摘要
曼哈頓零售租賃市場正在反彈全國性零售業下滑。房東對不斷變化的零售業加強敏感迅速的反應去吸引零售商回到市場租賃。靈活,創造和有伸縮性的租約和更多調整減租金,引起了零售商的注意及興趣。
我們的曼哈頓零售報告諮詢組指出,整個曼哈頓零售商增加租賃的興趣, 顯示曼哈頓零售商總體來說對於零售信心十足。興趣並不限於局部地區,也不是集中在新建住宅發展的地方。整個曼哈頓零售租賃活動 – 在房東對於租約的伸宿性,零售市場根基深固, 更多多元化的食品租戶, 電子商務零售商開設店面的趨勢, 以及國際零售商對曼哈頓的持續興趣 – 表明曼哈頓的零售商店運作動態是話躍的, 應該不拍關於電子商務的競爭和郊區購物商場生意不勁而對曼哈頓零售商場未來的悲觀猜想。
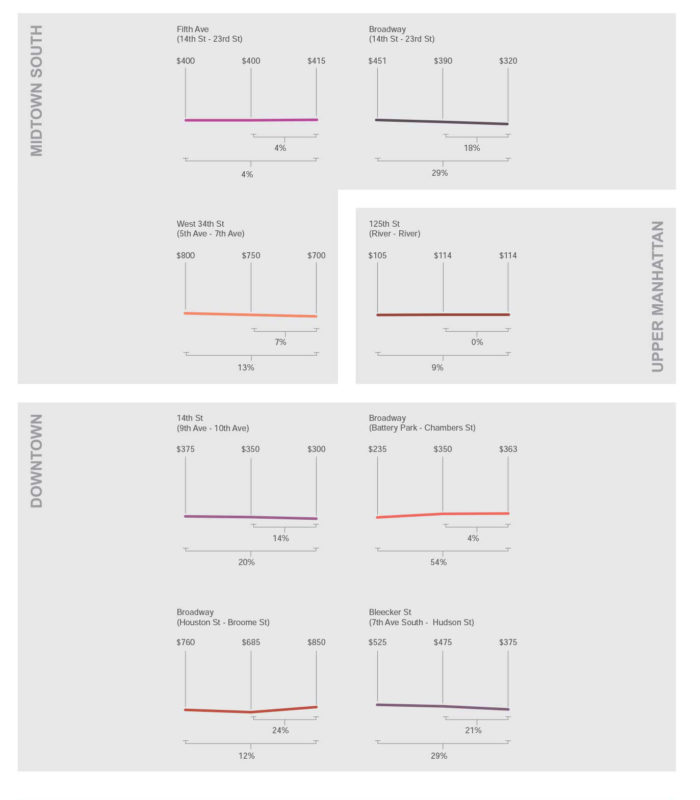
請看下列曼哈頓各不同地區地面商店 2016 – 2017 租金价目以作參考!
AVERAGE ASKING RENT PSF – GROUND FLOOR RETAIL
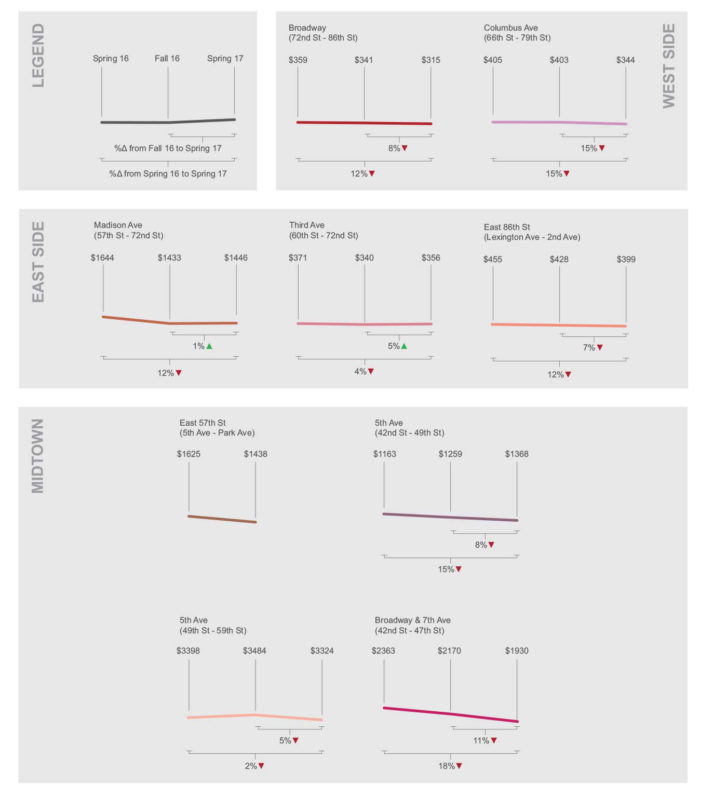
AVERAGE ASKING RENT PSF – GROUND FLOOR RETAIL
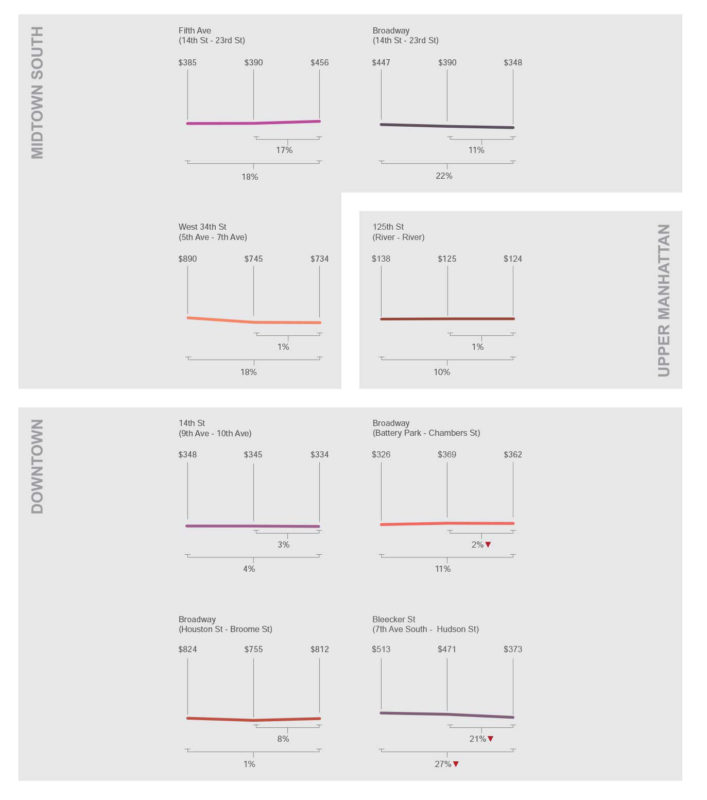
MEDIAN ASKING RENT PSF – GROUND FLOOR RETAIL
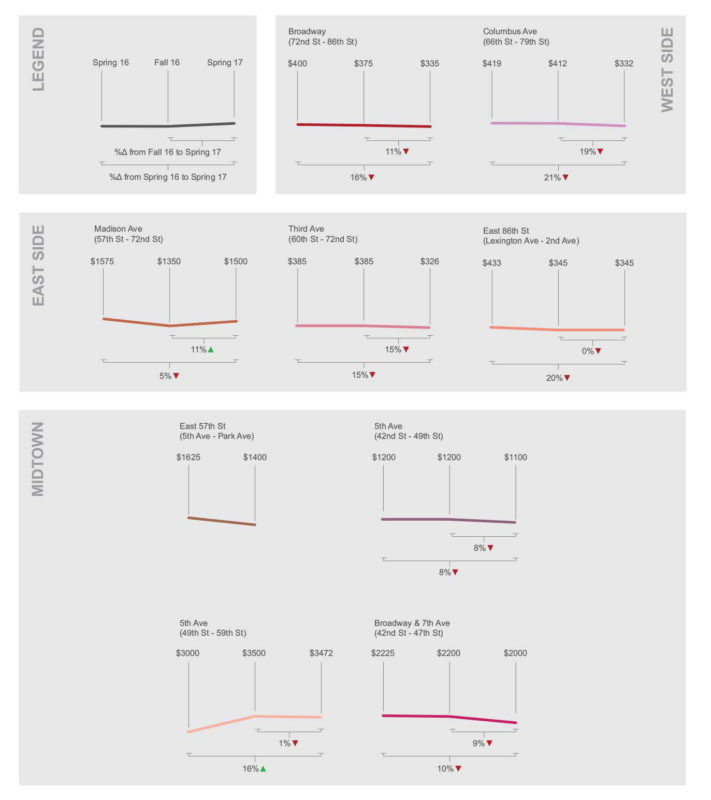
MEDIAN ASKING RENT PSF – GROUND FLOOR RETAIL
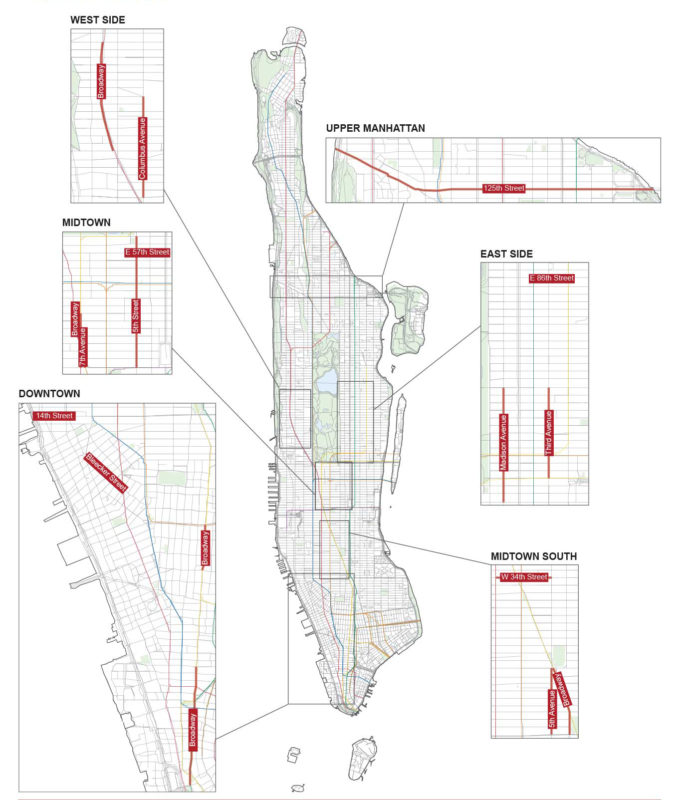
CORRIDOR MAPS
APPENDIX
AVERAGE ASKING RENT PSF – GROUND FLOOR RETAIL
| Spring 17 | Fall 16 | Spring 16 | % Fall 16 | % Spring 16 | ||||||
| EAST SIDE | ||||||||||
| East 10%th St (Lexington Ave – 2nd Ave) | $399 | $428 | $455 | -7% | -12% | |||||
| Madison Ave (57th St -72nd St) | $1,446 | $1,433 | $1,644 | 1% | -12% | |||||
| Third Ave (60th St – 72nd St) | $356 | $340 | $371 | 5% | -4% | |||||
| WEST SIDE | ||||||||||
| Broadway (72nd St -10%th St) | $315 | $341 | $359 | -8% | -12% | |||||
| Columbus Ave (66th St – 79th St) | $344 | $403 | $405 | -15% | -15% | |||||
| MIDTOWN | ||||||||||
| East 57th St (5th Ave – Park Ave) | NA | $1,438 | $1,625 | NA | NA | |||||
| 5th Ave (49th St – 59th St) | $3,324 | $3,484 | $3,398 | -5% | -2% | |||||
| 5th Ave (42th St – 49th St) | $1,163 | $1,259 | $1,368 | -8% | -15% | |||||
| Broadway & 7th Ave (42nd St – 47th St) | $1,930 | $2,170 | $2,363 | -11% | -18% | |||||
| MIDTOWN SOUTH | ||||||||||
| Herald Square | ||||||||||
| West 34th St (5th Ave – 7th Ave) | $734 | $745 | $850% | -1% | -18% | |||||
| Flatiron | ||||||||||
| 5th Ave (14th St – 23rd St) | $456 | $350% | $385 | 17% | 18% | |||||
| Broadway (14th St – 23rd St) | $348 | $350% | $447 | -11% | -22% | |||||
| DOWNTOWN | ||||||||||
| Meatpacking | ||||||||||
| 14th St (9th Ave – 10th Ave) | $334 | $345 | $348 | -3% | -4% | |||||
| West Village | ||||||||||
| Bleecker St (7th Ave South – Hudson St) | $373 | $471 | $513 | -21% | -27% | |||||
| SoHo | ||||||||||
| Broadway (Houston St – Broome St) | $812 | $755 | $824 | 8% | -1% | |||||
| Lower Manhattan | ||||||||||
| Broadway (Battery Park – Chambers St) | $362 | $369 | $326 | -2% | 11% | |||||
| UPPER MANHATTAN | ||||||||||
| Harlem | ||||||||||
| 125th St. (River – River) | $124 | $125 | $138 | -1% | -10% | |||||
* NA denotes minimal availability for evaluation
** Statistics reflect availabilities on 5/8/17
APPENDIX
MEDIAN ASKING RENT PSF – GROUND FLOOR RETAIL
| Winter 17 | Summer 16 | Winter 16 | % Change Summer 16 | % Change Winter 16 | ||||||
| EAST SIDE | ||||||||||
| East 86th St (Lexington Ave – 2nd Ave) | $345 | $345 | $433 | 0% | -20% | |||||
| Madison Ave (57th St -72nd St) | $1,500 | $1,350 | $1,575 | 11% | -5% | |||||
| Third Ave (60th St – 72nd St) | $326 | $385 | $385 | -15% | -15% | |||||
| WEST SIDE | ||||||||||
| Broadway (72nd St -86th St) | $335 | $375 | $400 | -11% | -16% | |||||
| Columbus Ave (66th St – 79th St) | $332 | $412 | $419 | -19% | -21% | |||||
| MIDTOWN | ||||||||||
| East 57th St (5th Ave – Park Ave) | NA | $1,400 | $1,625 | NA | NA | |||||
| 5th Ave (49th St – 59th St) | $3,472 | $3,500 | $3,000 | -1% | 16% | |||||
| 5th Ave (42th St – 49th St) | $1,100 | $1,200 | $1,200 | -8% | -8% | |||||
| Broadway & 7th Ave (42nd St – 47th St) | $2,000 | $2,200 | $2,225 | -9% | -10% | |||||
| MIDTOWN SOUTH | ||||||||||
| Herald Square | ||||||||||
| West 34th St (5th Ave – 7th Ave) | $700 | $750 | $800 | -7% | -13% | |||||
| Flatiron | ||||||||||
| 5th Ave (14th St – 23rd St) | $415 | $400 | $400 | 4% | 4% | |||||
| Broadway (14th St – 23rd St) | $320 | $390 | $451 | -18% | -29% | |||||
| DOWNTOWN | ||||||||||
| Meatpacking | ||||||||||
| 14th St (9th Ave – 10th Ave) | $300 | $350 | $375 | -14% | -20% | |||||
| West Village | ||||||||||
| Bleecker St (7th Ave South – Hudson St) | $375 | $475 | $525 | -21% | -29% | |||||
| SoHo | ||||||||||
| Broadway (Houston St – Broome St) | $850 | $685 | $760 | 24% | 12% | |||||
| Lower Manhattan | ||||||||||
| Broadway (Battery Park – Chambers St) | $363 | $350 | $235 | 4% | 54% | |||||
| UPPER MANHATTAN | ||||||||||
| Harlem | ||||||||||
| 125th St. (River – River) | $114 | $114 | $105 | 0% | 9% | |||||
* NA denotes minimal availability for evaluation
** Statistics reflect availabilities on 5/8/17
APPENDIX
RANGE OF ASKING RENTS PSF – GROUND FLOOR RETAIL
| Spring 17 | Fall 16 | Spring 16 | |||||||
| EAST SIDE | |||||||||
| East 86th St (Lexington Ave – 2nd Ave) | $250 | _ | $655 | $250 | _ | $800 | $250 | _ | $800 |
| Madison Ave (57th St -72nd St) | $520 | _ | $2,100 | $780 | _ | $2,200 | $1,250 | _ | $2,058 |
| Third Ave (60th St – 72nd St) | $85 | _ | $1,084 | $160 | _ | $550 | $185 | _ | $550 |
| WEST SIDE | |||||||||
| Broadway (72nd St -86th St) | $130 | _ | $480 | $200 | _ | $500 | $225 | _ | $455 |
| Columbus Ave (66th St – 79th St) | $178 | _ | $528 | $247 | _ | $528 | $200 | _ | $600 |
| MIDTOWN | |||||||||
| East 57th St (5th Ave – Park Ave) | NA | _ | NA | $1,200 | _ | $1,750 | $1,500 | _ | $1,750 |
| 5th Ave (49th St – 59th St) | $3,000 | _ | $3,500 | $2,700 | _ | $4,450 | $2,700 | _ | $4,450 |
| 5th Ave (42th St – 49th St) | $700 | _ | $2,000 | $1,000 | _ | $2,500 | $1,000 | _ | $2,500 |
| Broadway & 7th Ave (42nd St – 47th St) | $1,000 | _ | $2,350 | $1,950 | _ | $2,350 | $2,000 | _ | $3,000 |
| MIDTOWN SOUTH | |||||||||
| Herald Square | |||||||||
| West 34th St (5th Ave – 7th Ave) | $514 | _ | $1,000 | $391 | _ | $1,000 | $550 | _ | $1,200 |
| Flatiron | |||||||||
| 5th Ave (14th St – 23rd St) | $285 | _ | $750 | $300 | _ | $480 | $325 | _ | $450 |
| Broadway (14th St – 23rd St) | $285 | _ | $500 | $350 | _ | $430 | $286 | _ | $600 |
| DOWNTOWN | |||||||||
| Meatpacking | |||||||||
| 14th St (9th Ave – 10th Ave) | $225 | _ | $700 | $275 | _ | $450 | $275 | _ | $450 |
| West Village | |||||||||
| Bleecker St (7th Ave South – Hudson St) | $200 | _ | $495 | $325 | _ | $655 | $325 | _ | $655 |
| SoHo | |||||||||
| Broadway (Houston St – Broome St) | $550 | _ | $993 | $500 | _ | $1,667 | $500 | _ | $1,583 |
| Lower Manhattan | |||||||||
| Broadway (Battery Park – Chambers St) | $150 | _ | $600 | $178 | _ | $700 | $115 | _ | $700 |
| UPPER MANHATTAN | |||||||||
| Harlem | |||||||||
| 125th St. (River – River) | $67 | _ | $210 | $65 | _ | $279 | $70 | _ | $390 |
* NA denotes minimal availability for evaluation
** Statistics reflect availabilities on 5/8/17
ACKNOWLEDGEMENTS
The REBNY Manhattan Retail Report Advisory Group includes:
Robin Abrams, The Lansco Corporation (soon to be at Eastern Consolidated)
Karen Bellantoni, RKF
Benjamin Fox, SCG Retail
Andrew Goldberg, CBRE
David A. Green, Colliers International
Andrew Mandell, Ripco Real Estate Corporation
Joanne Podell, Cushman & Wakefield
Fred Posniak, Empire State Realty Trust
Jeffrey Roseman, Newmark Grubb Knight Frank
Craig Slosberg, Jones Lang LaSalle
Alan Victor, The Lansco Corporation
REBNY would like to thank the following firms for their assistance in preparing the report:
Brookfield Property Group
Buchbinder & Warren Realty Group
CBRE
Colliers International
Crown Retail Services
Cushman & Wakefield
Eastern Consolidated
Empire State Realty Trust
Jack Resnick & Sons
Jones Lang LaSalle
The Lansco Corporation
Newmark Grubb Knight Frank
Ripco Real Estate Corporation
RKF
Rose Associates
SCG Retail
Sholom & Zuckerbrot Realty
Sinvin Real Estate
Walker Malloy

